Hospital pharmacy teams already drive tremendous value by ensuring patients receive lifesaving medications every day. To keep that pipeline secure, they have long measured the performance of their external suppliers with familiar metrics such as fill rate.
Now, as drug shortages, tighter regulations, and cost pressures intensify, many pharmacy leaders are layering in KPI’s (key process indicators) to gain insight into supplier resilience.
Fill Rate Is Tactical — But Not Predictive
Fill rate confirms yesterday’s success, not tomorrow’s. A 100 % score tells you the supplier shipped what you needed, when you needed it—but offers no signal about how they’ll perform during the next shortage or usage spike. To see around corners, leading pharmacy teams’ layer predictive indicators onto the scorecard, turning a reactive metric into a proactive early‑warning system.
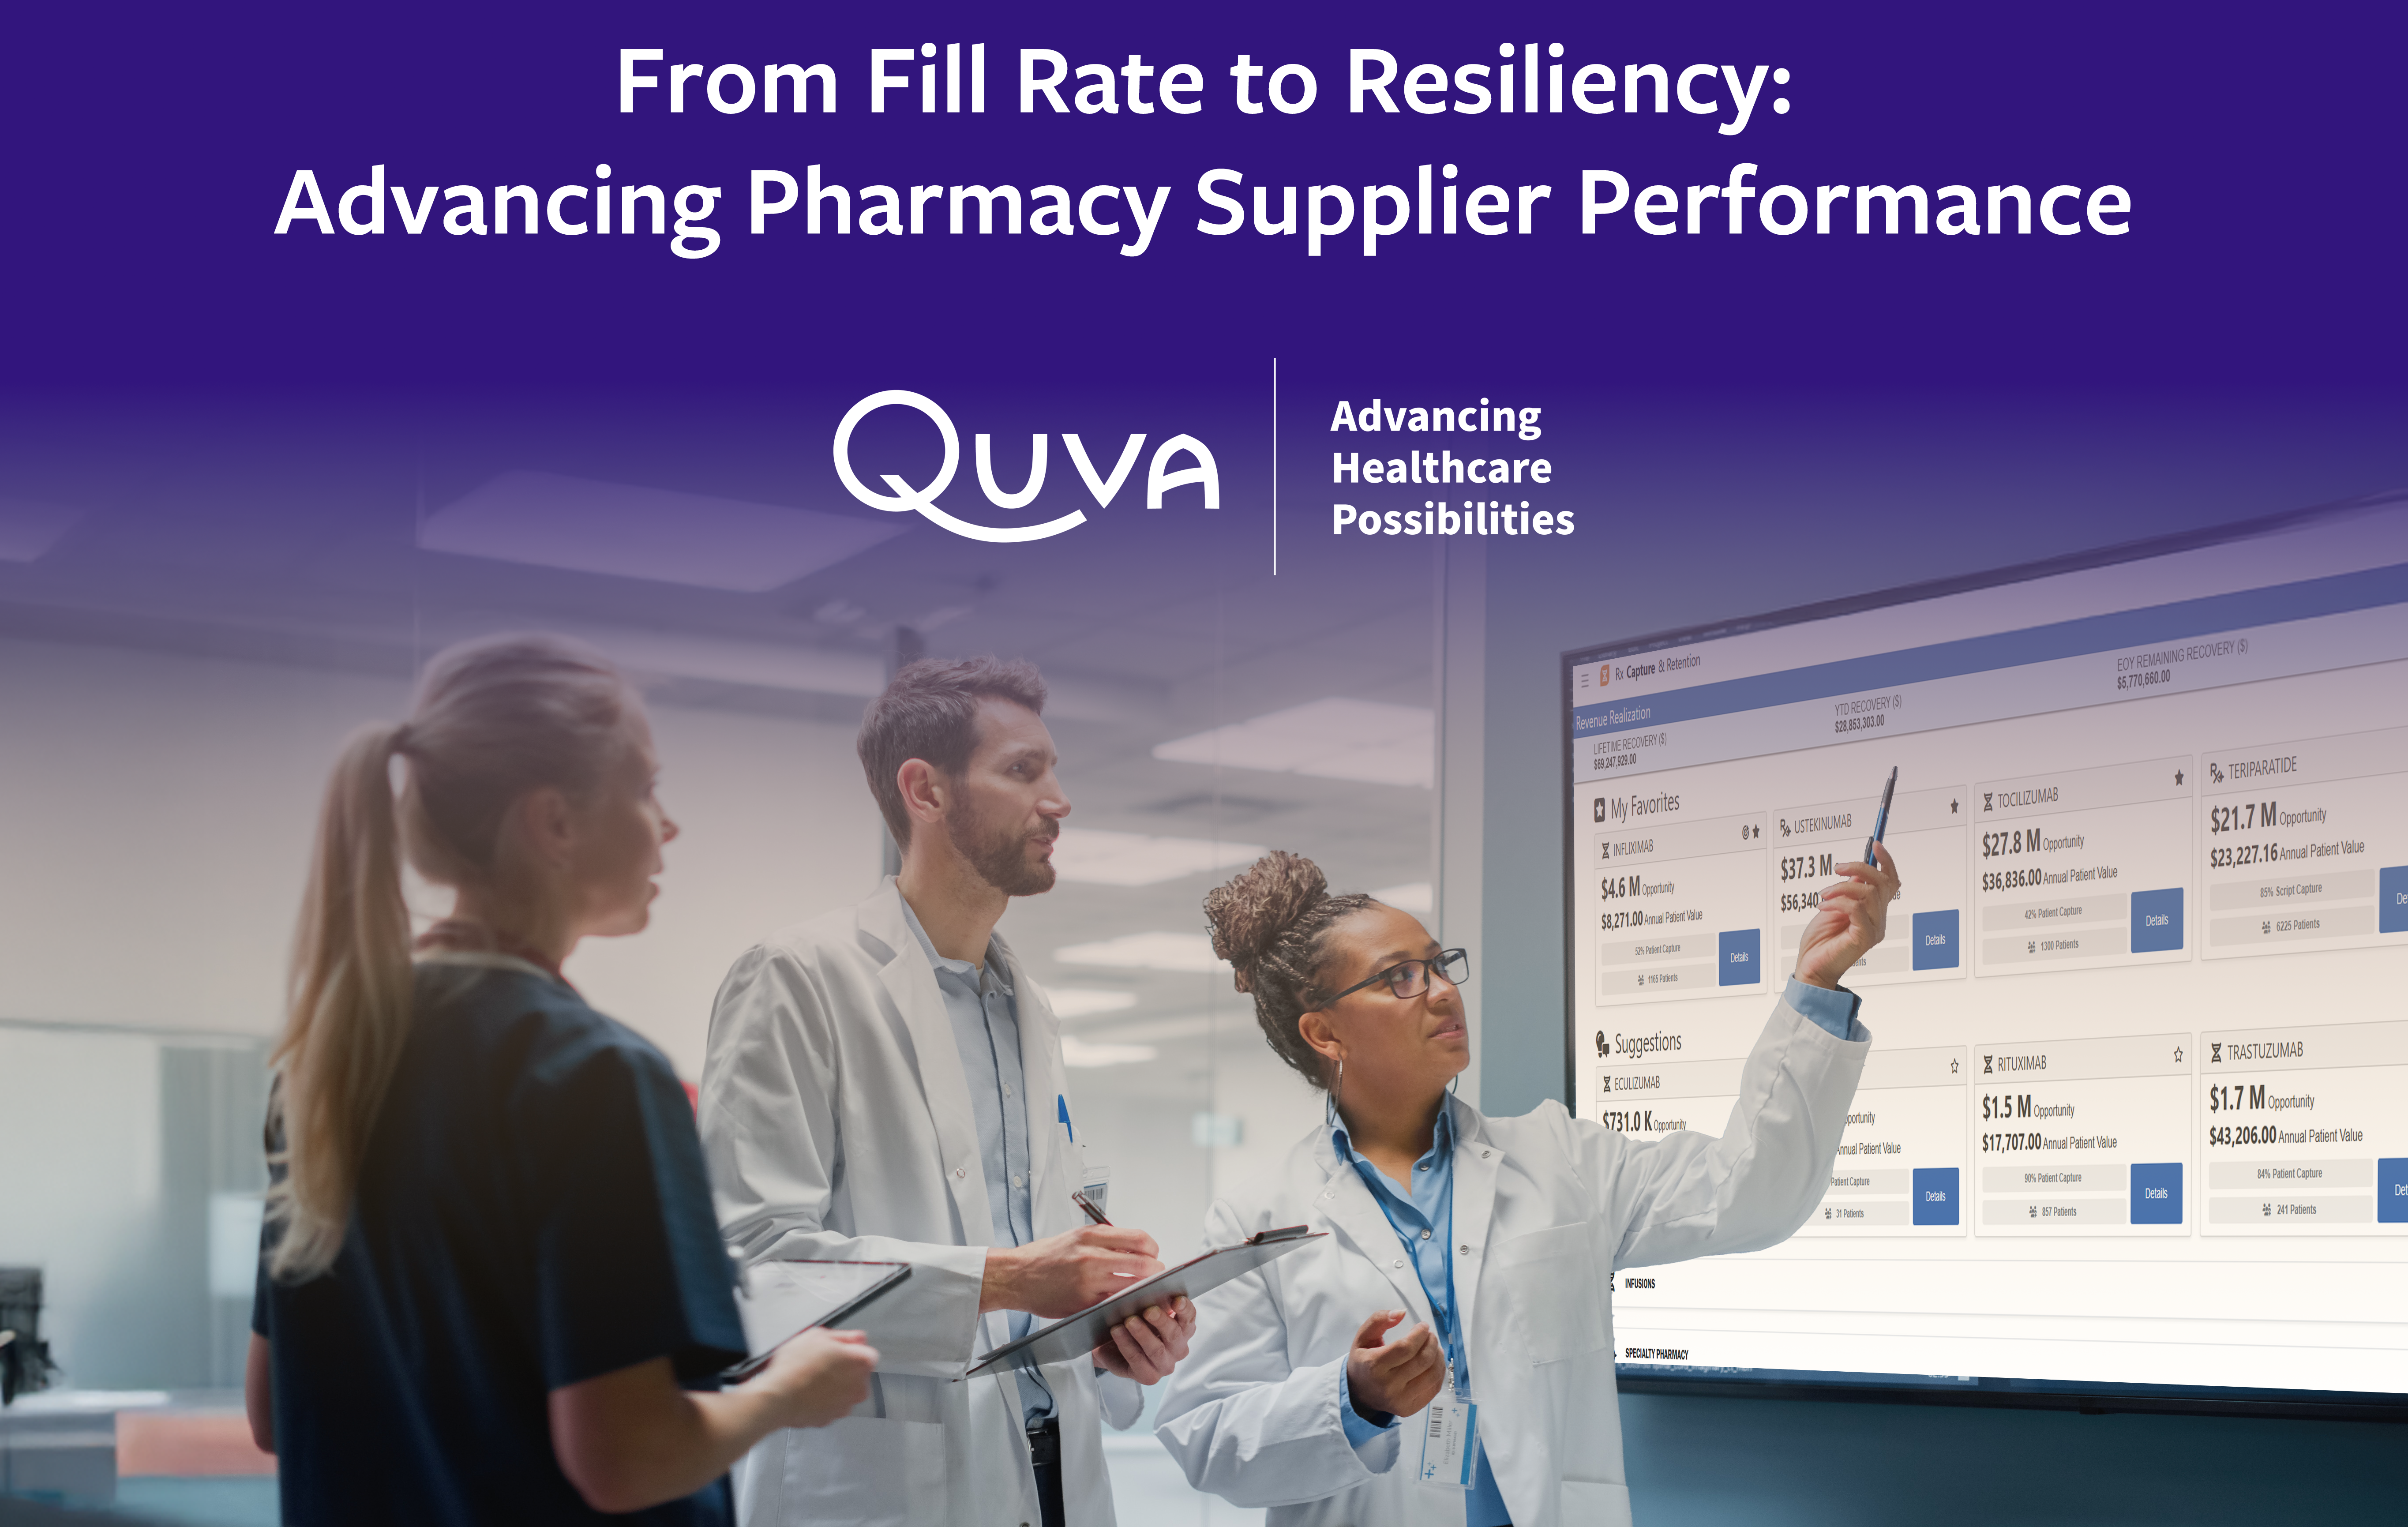
Pharmacy teams are converting these forward‑looking indicators into a Supplier Scorecard & Resiliency Index that rates wholesalers and their upstream manufacturers, CMOs, and API sources. The result is early visibility into supply risk—often weeks before it affects your dock. The next section details the criteria Quva BrightStream solutions uses to calculate each supplier’s resilience score.
From Fill-Rate Metrics to a Supply Resiliency Index
More than 82 % of hospital pharmaceutical purchases are fulfilled by three national wholesalers. Their performance metrics provide a baseline; however, a comprehensive picture of supply‑chain resilience emerges only when upstream partners—manufacturers, contract manufacturing organizations (CMOs), and active‑ingredient suppliers—are evaluated as well. While wholesaler scorecards offer a useful reference point, layering upstream insights onto that foundation reveals vulnerabilities and strengths within the therapeutic areas and patient populations most critical to your institution.
Round out the view by layering in contract intelligence from your group‑purchasing organization (GPO)—rebate tiers, committed lead‑times, and escalation clauses all influence long‑term reliability.
Once those upstream signals are captured, convert them into a five‑point rubric:
|
Criterion |
What it Signals |
|
Manufacturer Size |
Larger pharmaceutical companies typically maintain redundant lines, deeper safety stocks, and mature quality systems. |
|
Medication Price Point |
Higher‑priced drugs carry healthier margins, allowing firms to invest in capacity and risk‑mitigation projects. |
|
Dosage Form |
Sterile injectables face the highest shortage rates; oral solids and topicals are generally less vulnerable. |
|
Therapeutic-Class History |
Oncology, anesthesia, and critical‑care classes have cycled in and out of shortage; we weight them more heavily. |
|
Essential Medications Status |
Drugs on the FDA Essential Medicines List receive extra regulatory scrutiny, which bolsters long‑term availability |
Because every health‑system faces unique exposure points, factor your own hospital-specific risk—such as:
- Regulatory change management
- Geographic concentration of active‑ingredient (API) sources
- Contracting terms and tariff exposure
Weigh these attributes according to patient‑care impact and roll them into a single Supplier Resiliency Index.
Prefer a turnkey route? Quva BrightStream Supplier Resiliency Index (SRI) solution automates the data pulls, weighting, and index calculation: delivering an out‑of‑the‑box dashboard:
- 93% market visibility. The SRI scores greater than 110,000 National Drug Codes (NDC) covering the nearly the entire U.S. drug market
- Proven shortage defense. In 2023, nine health systems avoided 94,000 wholesaler omissions and maintained 100% fulfillment by acting on SRI alerts.
- AI-driven insights. Machine-learning models refresh daily.
Bridging Resiliency Gaps: How Additional Capacity in Quva Pharma Sterile Injectable Compounding Solutions Becomes Your Safety Net
After you identify exposure points in the Supplier Resiliency Index, the next question is who can fill those gaps? This is where Quva Pharma solutions and capabilities come into play—providing ready‑to‑use, GMP‑manufactured inventory that cushions hospitals against shortages and demand spikes.
- Added 44,000 sq ft of 3PL space in Phoenix, Arizona and 20,000 sq ft in Sugar Land, Texas. This allows us to hold more days of inventory. In 2026, QuVa will add an additional 55,000 sq ft of manufacturing space in Sugar Land.
- Extended our BUDs by 100% for 27 active products – increasing from 90 days to 180 days. This initiative belongs to our broader supply-resilience program.
- Continued expansion of our ready-to-administer product portfolio offering Sterile Drug Product and API in times of drug shortage and to meet clinical need—ensuring the redundancy needed in delivering reliable compounded sterile drug supply.
Conclusion – Keeping Patients First
Hospital pharmacy teams already provide exceptional value, ensuring safe, on‑time medication for every patient, every day. Fill rate will always be part of that story, but it no longer tells the whole story. By pairing forward‑looking KPIs with a Supplier Resiliency Index, pharmacy leaders gain a clear line of sight to future risk and a practical, collaborative roadmap for addressing it. QuVa is committed to making that journey easier—expanding 503B capacity and delivering BrightStream’s data‑driven insights—so you can stay focused on what matters most: patient care.
If you’d like to explore how these evolving KPIs could be used to strengthen your procurement strategy, we’d be happy to share more. Please click here to receive additional information about the progress being made at Quva, both for our Quva Pharma compounded sterile drug solutions, as well as our Quva BrightStream data and insights software solutions.

